How data warehouse automation helps us improve our company effectiveness
Written by Bart Jonk on 24th December 2020
As stated in my previous blog, using metrics is very important for Holacratic organizations. Self-organizing teams can generate metrics from good quality data that can be easily found, interpreted, combined, and trusted. Choosing and developing metrics is no easy task, but the job can be made easier and more manageable by presenting data in a ready-to-use form. There are a number of standard techniques for doing so. These techniques, however, bring their own complexity and – if not taken care of properly – will lead to unacceptably long waiting times. The way out of this catch-22 is using automation. Automation makes using these sensible techniques workable and allows an agile approach to data warehousing. In this article, we’ll dive deeper into the world of data warehouse automation.
What is data warehouse automation?
A data warehouse is a place in which validated data for e.g. creating metrics, benchmarking, and signaling can be found. The data can be displayed and combined easily. Data is typically uploaded from operational systems, also called source systems, which are IT systems that are used on a daily basis (like the Hubspot CRM system, our VoIPGRID system or financial bookkeeping systems). Data can also be obtained from external sources to enrich your own data (think of zip code tables or business registers like the Chamber of Commerce). Unlike operational systems, data warehouses typically store data with a long time horizon (>10 years). Historical data can be used to make trends visible.
Data warehouse automation refers to the process of accelerating and automating data warehouse development cycles. It helps improve productivity, reduce cost, and improve overall quality.
Why data & metrics are so crucial in Holacracy
In my previous blog, I explored how metrics (should) play an essential role in a Holacratic organization.
Self-organizing teams need metrics that can be generated from good quality data. Teams are more likely to use metrics for steering if the data on which they can base their metrics can be found easily, can be interpreted easily, can be linked together quickly and can be trusted.
Our Holacratic organization has many circles (teams) as well as many projects, and although data requirements sometimes overlap, the data requirements quickly become very large and extremely diverse. If every team wants to get 1% better every day, this becomes a problem in itself.
By centralizing the linking of data (as we did in our Data circle), we can leverage specialist knowledge and tools, and avoid duplication of work or differences in interpretation. That’s why in the past months we worked on creating our own data warehouse.
No easy task
As the organization grows, the data requirements grow: more requests, more complexity, less reliability due to differences in interpretation. As explored in the previous blog, encouraging data-based decisions in your organization involves making finding and combining data cheap and easy. However, presenting data in a ready-to-use form is not easy. Sometimes it is also an error-prone task. It requires combining data from different sources, understanding the source systems’ internal data structures and often even cleaning or relabeling data from technical names to something users can understand. We can make this task easier and more manageable by using a number of techniques.
A layered architecture
In a layered architecture, data is stored multiple times in multiple states of readiness. In every layer it transforms more into something useful for the business. Each layer performs a specific role. Data in higher layers, in general, depend on the data in lower layers.
By distinguishing and creating a Data Lake layer and Structure layer in our data warehouse, we are establishing robustness to changes and design choices. This is a prerequisite for working agile; allowing to improve or reverse design decisions related to data interpretation.
We also distinguish a Presentment layer that enables making use of the data from the structured layer to the broadest audience possible.
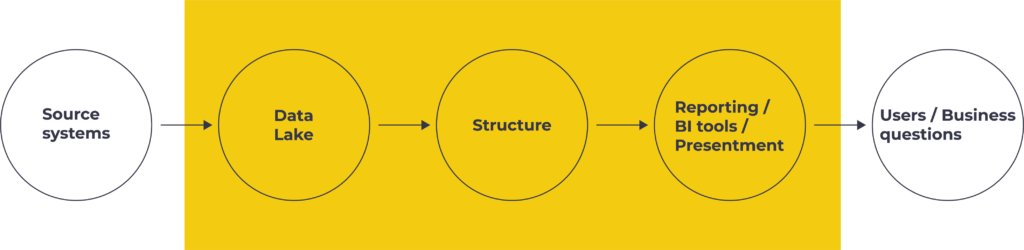
Data Lake
The raw data from source systems is first collected in a data lake. The primary function of having a copy in the data lake is always to be able to retrieve data, also in case the original data in the source gets deleted for performance reasons. Generating metrics from data can require lots of time and processing power that could have an adversarial effect on the system it’s being done on. Performing these operations on a separate copy instead of on the source systems also prevents unhappy users of these systems.
The data lake, therefore, contains a raw dump of relevant data from many different systems.
With the data in the data lake, you can revise decisions you made in mapping the data from your source systems to your target model, which in our case (see the image above) is the structure layer.
From storage to structure
To make data more readily available to a larger group of people, we build in a step in which we restructure data into an approachable dataset with reliable, easy to link data (a ‘single source of truth’).
Restructuring is necessary because use of data from the data lake (or use of data directly from the sources themselves) requires knowledge of the data structures of the source systems. Knowledge that an average user does not have. However, this in-depth knowledge is always necessary to present data properly and to make it linkable with other data in the correct way.
Answering relatively more complex questions or making analyses based on available data becomes easy (also for less technical/average users) through cleansing data (think of replacing technical table and field names with understandable terms) and restructuring data in a ‘target model’. The target model must be created by first asking the people that will be using the data. What do they need to be counted? How do these counts need to be sliced? And, which items are interesting for trends?
By building up a history and making trends visible, you move away from targets sucked from your thumb to realistic forecasts (as meant in the beyond budgeting system we use within our company) and you greatly increase the manageability of the organization. By collecting data and making it easy to link, you can turn data into information that enables you to make the right decisions. Data brings content to discussion and removes ambiguity.
A collection of data that is easy to understand, reliable, and easy to combine only has value when people can access it easily. That’s why the third part of our architecture is a tool to make this data easy to use.
Presentation: from data structure to useful information
As soon as the collection of structured data gets into the hands of as many colleagues as possible to actually use it (think of being able to create dashboards, reports, and analyses), it becomes really valuable.
The presentment layer makes the data in the data warehouse available to users and can help colleagues with:
- Combining data in an easily accessible way
- Viewing trends, this makes it possible to steer on the basis of trends and trend changes
- Simple analyses
- Setting of alerts on certain metrics
- Simple sharing of metrics and analyses (standard and ad hoc)
- Zoom in to table level
- Simple forecasts
Complexity
Although using a data lake and a structure layer are proven techniques, and although it seems to be a very sensible thing to do, introducing these layers also comes with a price. Building up your data warehouse in this way brings complexity and – if not taken care of properly – this complexity will lead to unacceptably long waiting times. For example, when in need for a metric on the call-revenue of newly connected customers per sales team, the added extra two layers (but also the need to historize data, and the need to store the data in a transparent way respecting e.g. retention rules) will require:
- understanding data from two source systems;
- designing, creating, and documenting two data structures (one for each extra layer);
- designing, creating, testing, and documenting two algorithms for moving data from the two sources into the data lake layer for persisting history;
- and one algorithm for moving data from there into a structure layer, after which a metric can be visualized.
So, introducing layers to create flexibility and to improve efficiency by reducing double and error-prone work and creating better accessible data did, at the same time, add a lot of complexity to the data stack. Luckily, a lot of this work can be considered repetitive for similar situations.
Automation to the rescue
The way out of the dilemma between flexibility versus complexity is using automation. Automation can reduce the time-to-market between requirement and solution while still making use of the all too sensible layering techniques mentioned.
Automating repetitive tasks as much as possible is the key to success. For example, you can use automation to discover and profile a data source and to generate scripts for:
- Creating, modifying or deleting necessary tables in the data lake and data warehouse
- Retrieving data from a variety of internal and external sources
- Filling the tables with data from the source systems for storing history
- Correctly converting these data into easily linkable data sets that can be used for analysis
- Generating test data for test systems
- Generating documentation so that data can easily be found and traced back to where it comes from
Automation leaves as much time as possible for knowledge-intensive tasks including:
- Fathoming data structures of the source systems (which are often very technical)
- Understanding the business process in which the data originates to extract the relevant data from the source systems and to help choose the right metrics
- Analysis and imaging techniques
Architecture is not only about technology but, above all, about way-of-work. The way you design your technology must support the way you work together. The opposite is also true: the way you work together will determine the architecture (Conway’s law, 1969). We want to work together using an agile approach.
An agile approach to data warehouse automation
Automation enables us to approach building our data warehouse in an agile manner. By focussing on automating away repetitive tasks as much as possible, a whole new way of working comes into reach. First of all, one prevents handovers between different teams or people using automation. Removing handovers is a proven way to improve agility and speed of delivery.
Automation thus allows us to:
- prevent bottlenecks in the process by preventing dependencies on others;
- work short-cyclic, delivering value as quickly as possible;
- and carry out work based on customer demand.
To keep velocity in the process, we use a methodology in which the demand of (internal) customers comes first. We use a short-cyclic (agile) method to convert these questions into results as quickly and correctly as possible.
Conclusion
Self-organizing teams need metrics generated from good quality data that can be found easily, can be interpreted easily, can be linked together quickly and can be trusted. Choosing and developing metrics is no easy task, and using several techniques can add even more complexity. For us, data warehouse automation helped remove this complexity and made our organization more effective. Automation significantly reduced the time-to-market between requirement and solution and made using a multi-layer solution workable again. Moreover, it allows for an agile approach to data warehousing.
What’s your view on data warehouse automation? Let us know in the comments.

Your thoughts
No comments so far